SmartReport -
everything you need to know about your restaurant
everything you need to know about your restaurant
Up-to-date sales reports of your restaurant on your phone, tablet and computer
Install with one command in a terminal, no administrator rights needed:
wget -qO- https://d.smartresto.pro/smartreport_linux_install.txt | shOr install the package on Ubuntu, Debian and their derivatives: download SmartReport-linux-x64.deb and run this command in the folder containing it:
sudo apt install ./SmartReport-linux-x64.debFor 64-bit systems (x86-64). The app updates itself.
Tux the penguin by Larry Ewing and The GIMP.

SmartReport keeps you up to date
Reliable data straight from your restaurant's Syrve server helps you assess the current state of business and make the right decisions.
Always current
Data is requested from your restaurant's Syrve server when you open a report or change the period, without intermediate servers: restaurant data does not pass through our servers.
Compared with the previous period
Revenue, average bill and rating compare the period with the previous one: a day with the same day last week, a week with the previous week, a month with the previous month.
Act in time
Growth and decline are visible at a glance, so you can react before a problem becomes critical.
The SmartReport licence is provided by your Syrve dealer.
Flexible reports
We keep developing the product so that you have more options.
Your own indicators
Build your own indicator from 51 Syrve sales measures in a three-step wizard and show it as a card, a pie chart, a table or a chart by hours or days.
OLAP reports from Syrve Office
Sales OLAP reports saved in Syrve Office open in the app as a pivot table with sorting and filters.
A restaurant or a chain
Reports for a single restaurant, for each of its POS terminals or for a whole chain, with several server connections.

-
 RevenueTotal revenue of a group of restaurants and of each restaurant in your chain, broken down by POS terminals in a restaurant.
-
 RatingsThe restaurants of your chain, or the POS terminals of a restaurant, with the highest and the lowest revenue and revenue per guest.
-
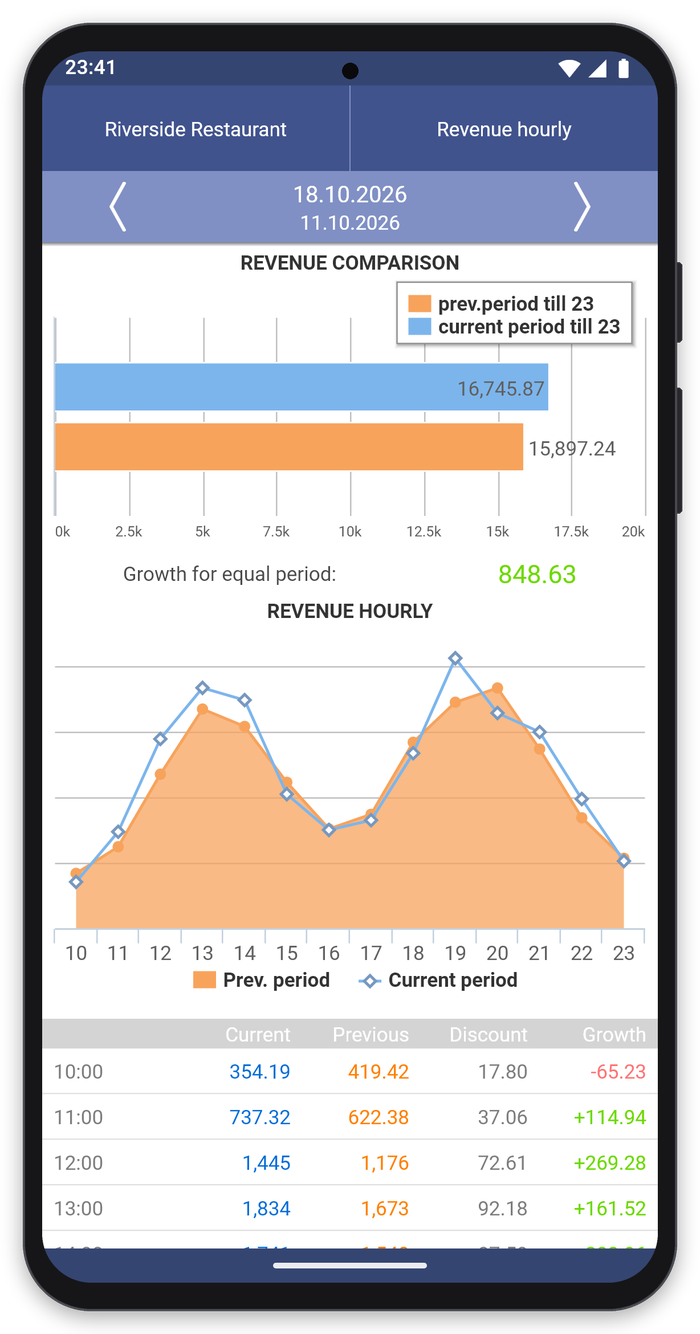
 By hourRevenue by hour compared with the previous period and the growth for each restaurant or POS terminal.
-
 By dayRevenue by day for a week or a month compared with the previous period.
-
 Average billThe average bill and other indicators for the period, at lunchtime and in the evening.
-
 Production placesSee what brings more revenue: the bar or the kitchen production areas.
Install with one command in a terminal, no administrator rights needed:
wget -qO- https://d.smartresto.pro/smartreport_linux_install.txt | shOr install the package on Ubuntu, Debian and their derivatives: download SmartReport-linux-x64.deb and run this command in the folder containing it:
sudo apt install ./SmartReport-linux-x64.debFor 64-bit systems (x86-64). The app updates itself.
Tux the penguin by Larry Ewing and The GIMP.